[1] "StartDate" "EndDate" "Status"
[4] "Progress" "Duration (in seconds)" "Finished" R & Quarto: Elevating Research Transparency
David Brocker
Roadmap
- Research
- Teaching
- Service
- Documentation
- Fun
Research
- Example
- Import Data
Import Data
Import Data
# Read and Clean Data
 mcu <- read_excel("UpdatedMCdata.xlsx")
# Clean
mcu_cln <-
mcu %>%
# Get participants who finished
filter(Finished == "1") %>%
# Get participants who consented
filter(`Consent?` == "1") %>%
# Remove unneeded columns
select(-DistributionChannel,-UserLanguage) %>%
# Clean variable names
rename_with(~gsub(" ","_",.x)) %>%
# Make Score Columns numeric
mutate_at(vars(SC0:SC14),as.numeric) %>%
# Remove SC0 and replace with scale name
rename(
Morbid_Curiosity_Overall = SC0,
Mind = SC1,
Body = SC2,
Violence = SC3,
Paranormal = SC4,
Horror_Typology_Overall = SC5,
AJ = SC6,
WK = SC7,
DC = SC8,
Trait = SC9,
State_Pre = SC10,
Positive_Choice = SC11,
Negative_Choice = SC12,
PN_Choice = SC13,
State_Post = SC14) |>
mutate(
# Divide all MC Total Score by 24
Morbid_Curiosity_Overall = Morbid_Curiosity_Overall/24,
# Divide all HT Total Score by 19
Horror_Typology_Overall = Horror_Typology_Overall/19 ) |>
# Divide each MC Subscale Item by 6
mutate_at(vars(Mind:Paranormal),scale_six) |>
# Divide each HT Subscale Item by 6
mutate_at(vars(AJ:DC),scale_seven)Import Data
Visualize Data
Clean Data
Identify any nonstandard naming conventions (tOgglECase, Spaces in Name, etc.)
Clean with Regular Expressions 1 or
janitor
Name Cleaning
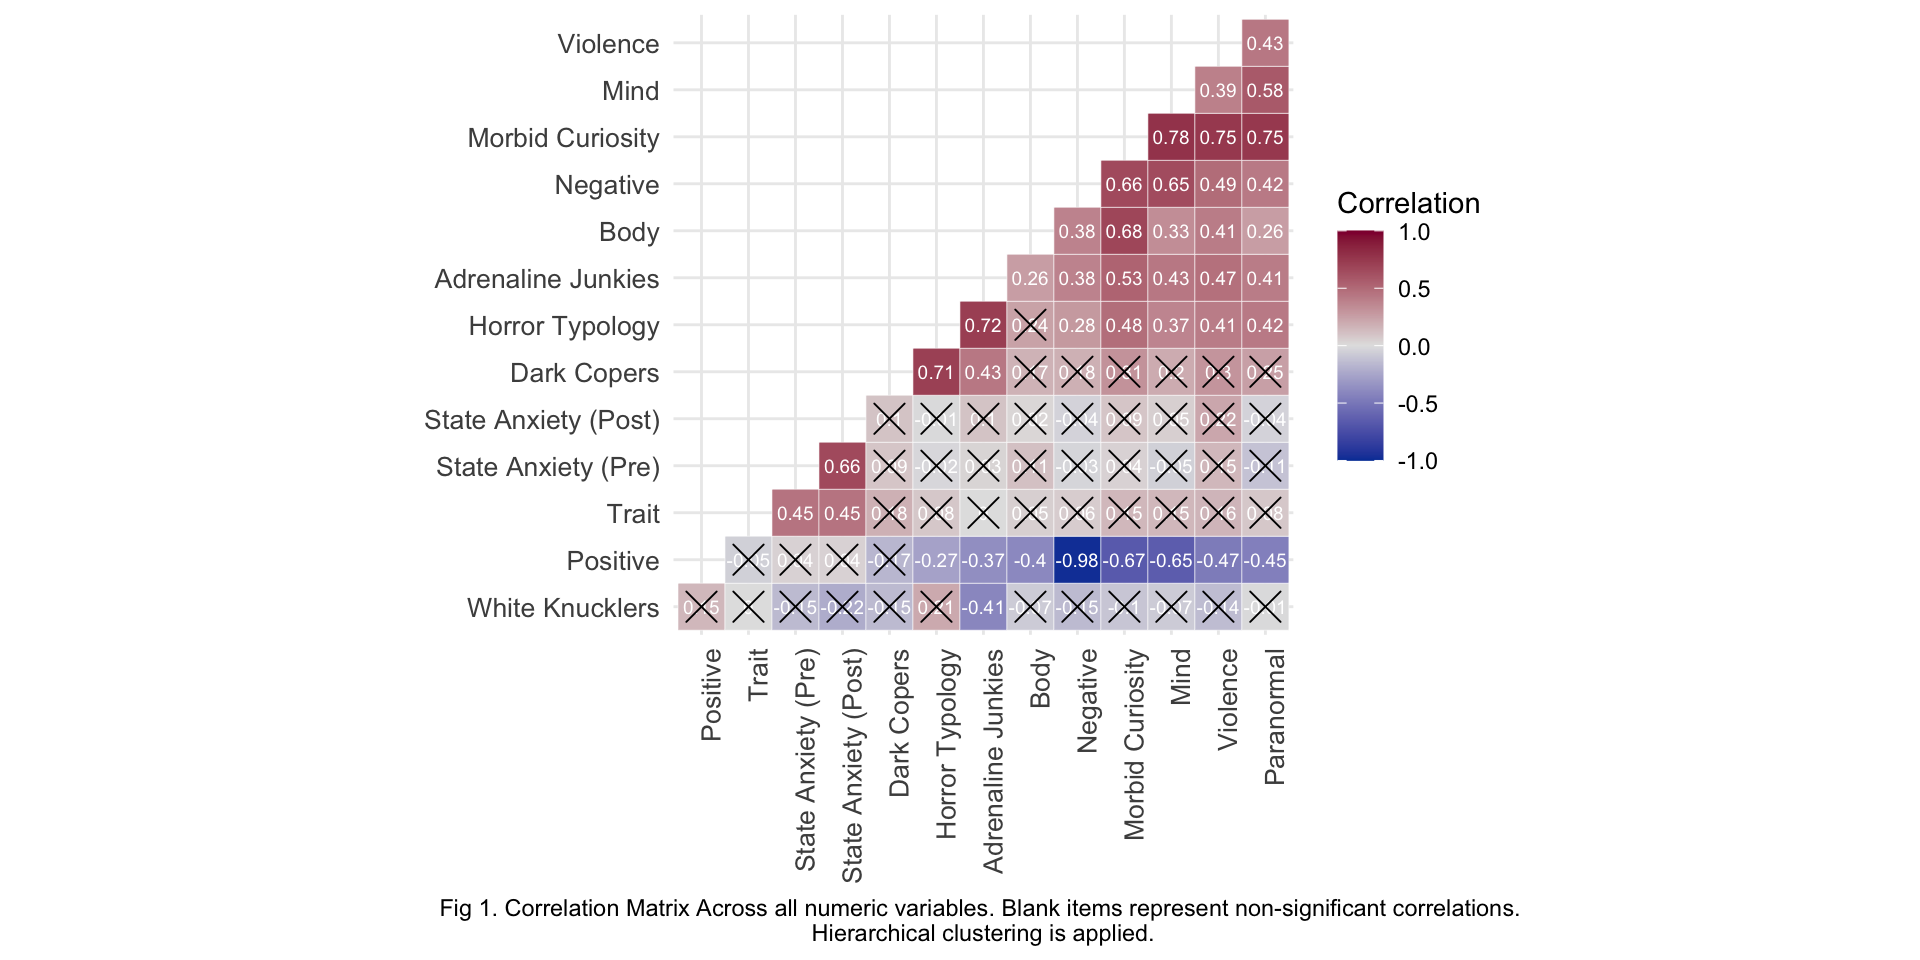
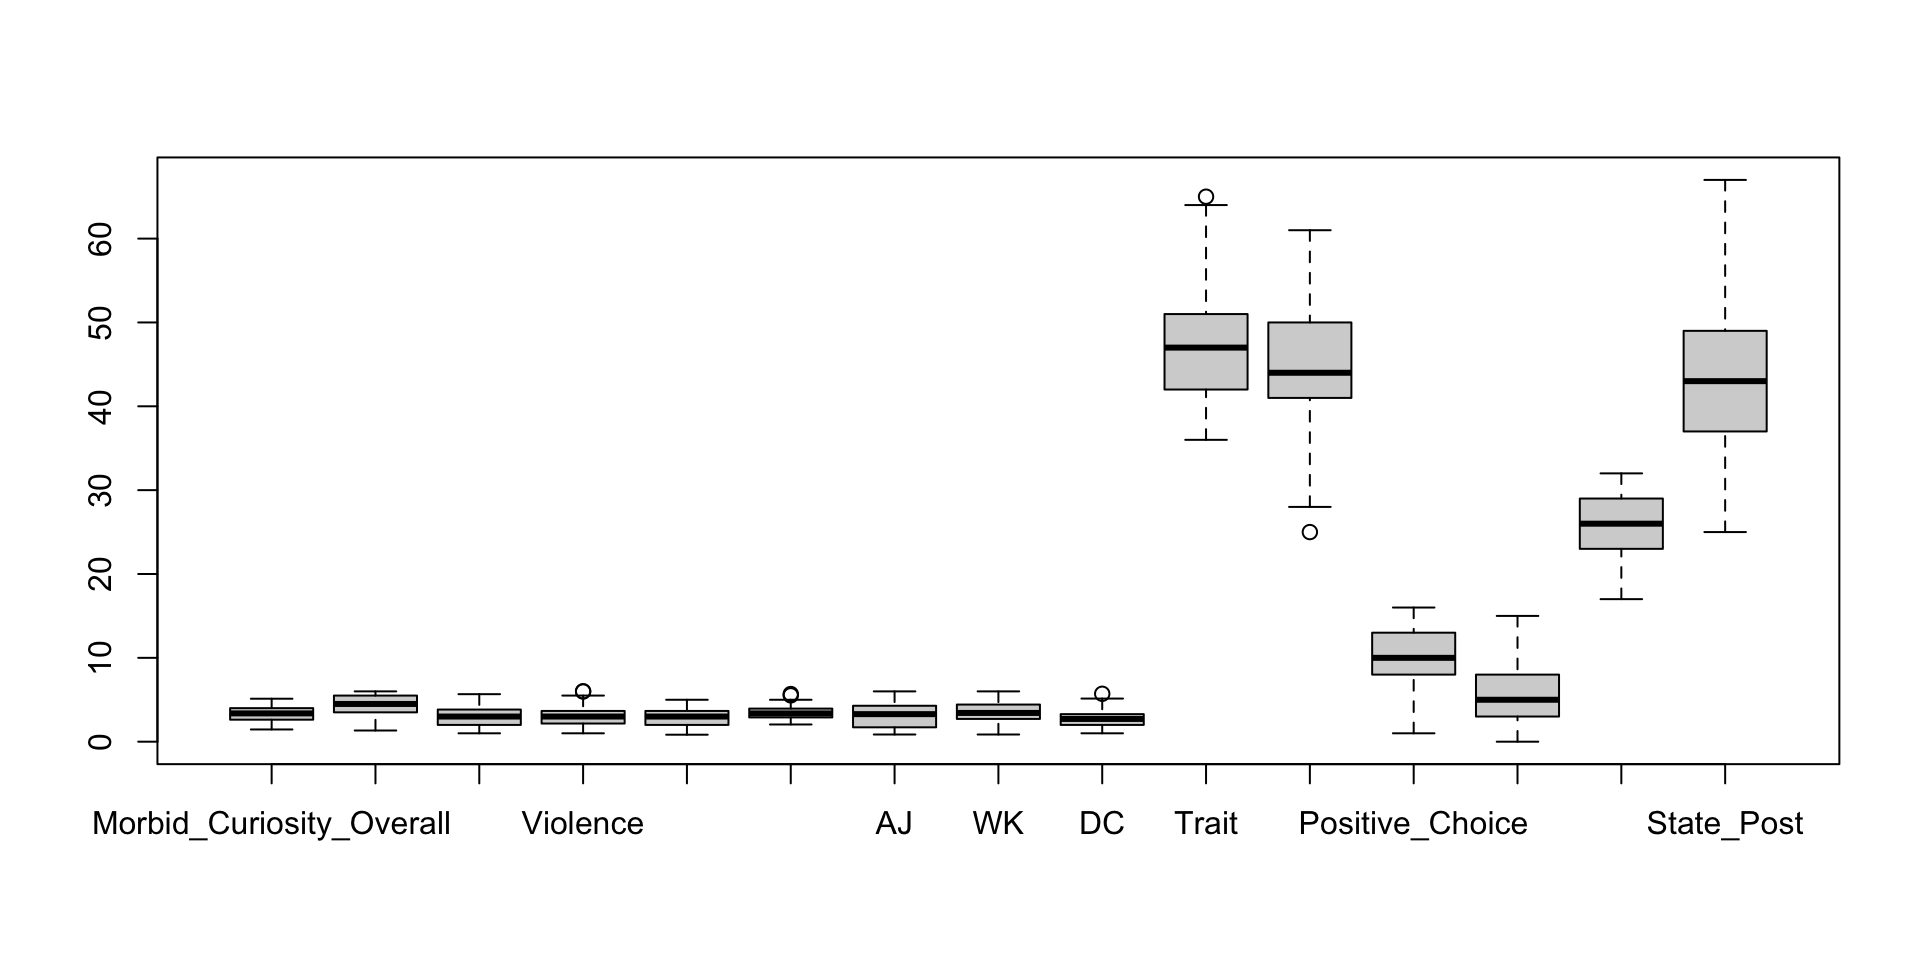
Exploratory Data Analysis
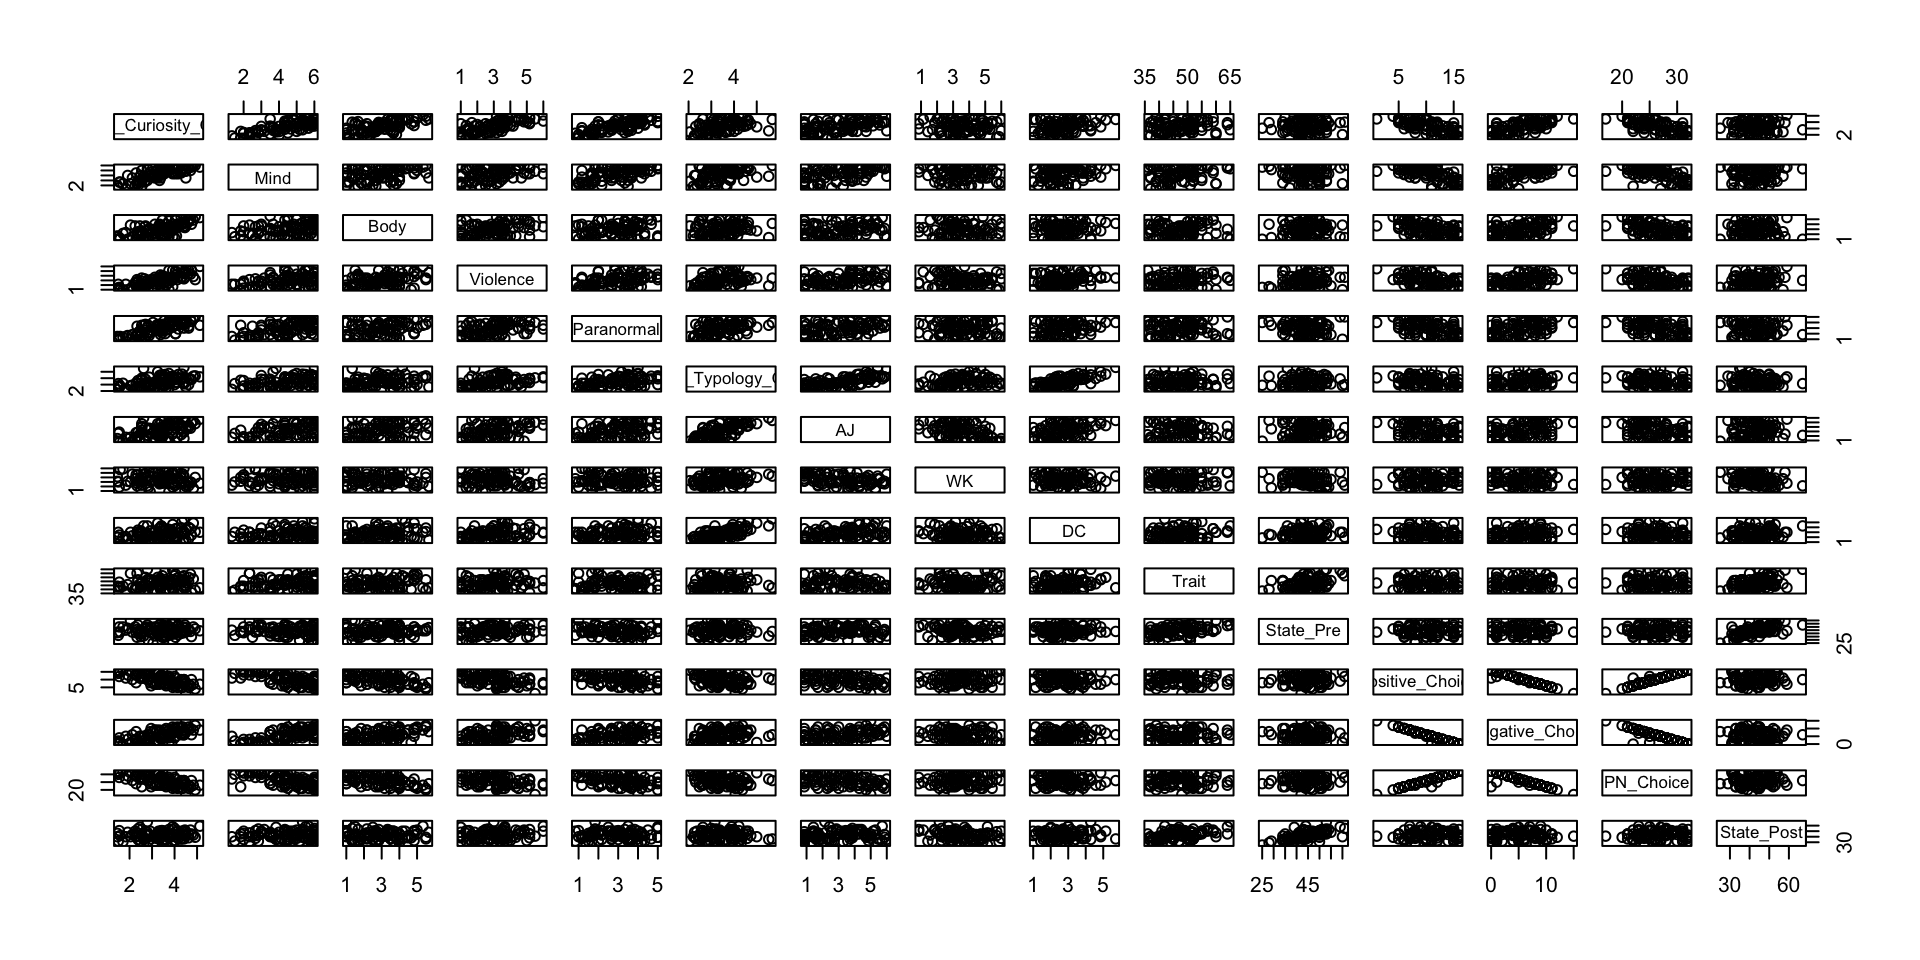
Exploratory Data Anlaysis
Teaching
Include Interactivity
Match Formatting
\(M = \Sigma\frac{x}{n}\)
Build Testing Materials
Service
- Evaluate Data
Internship Placements
Present Findings
Present Solutions
Emphasize Certain Areas
Direct Students to Specific Sites
Documentation
- Convert ‘static’ Documents
** Put Picture of PDF Manual Here **
- Update and Modernize